See the market context.
The Daily Levels Indicator brings previous-day levels, value, the frozen CME Open, ETH AVWAP and confirmed 5M structure together in one clean TradingView chart layer. See where price is. Understand the context. Make your own decision.
One chart. The references that matter.
The goal is not to fill the chart with signals. The indicator automatically maps the daily reference points used throughout NQ Route so you can quickly understand where price is trading and which market structure is currently active.
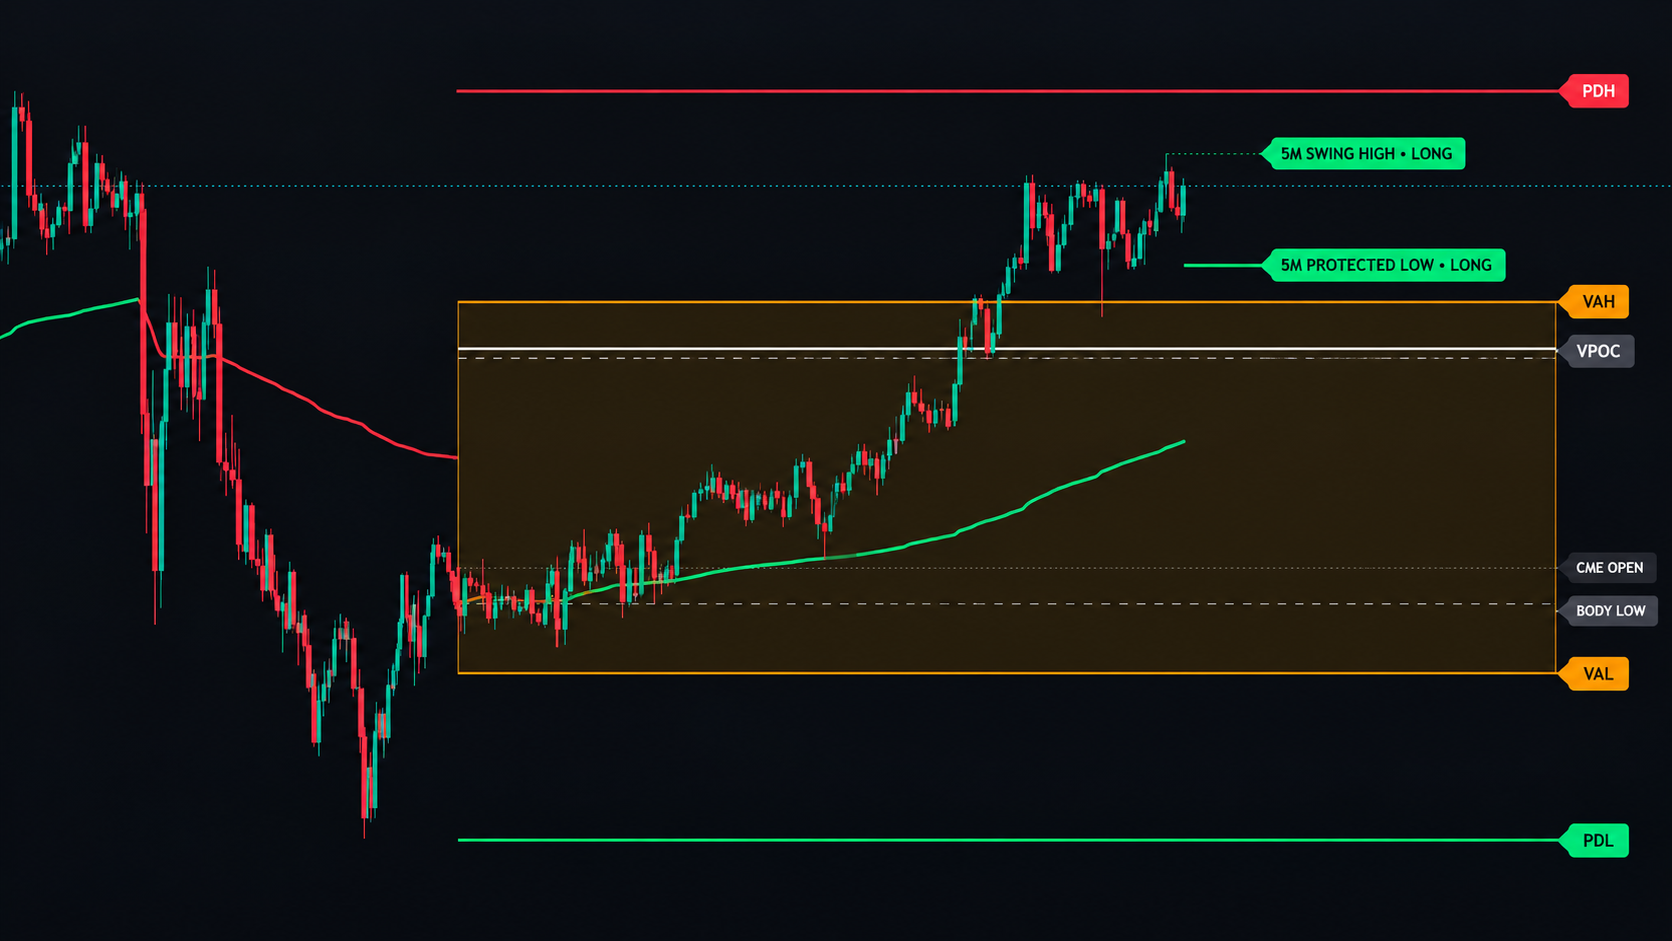
The daily market map.
Levels are reference points created by the previous auction. They are context, not automatic entries.
Previous-Day High & Low
PDH and PDL mark the extreme high and low of the previous CME/ETH trading day. They can act as liquidity references, targets and important reaction areas.
Body High / Low
The previous daily candle body separates the accepted body range from the more extreme wick movement and provides additional intermediate context.
VAH / VPOC / VAL
Previous-session value shows where the prior auction found acceptance. VAH and VAL define the value boundaries while VPOC marks the highest volume concentration.
Frozen CME Open
The true CME/ETH open at 18:00 ET is frozen for the full trading day and remains a fixed reference while the session develops.
ETH Open AVWAP
An Anchored VWAP develops from the same 18:00 ET session open and provides a dynamic view of where volume-weighted price is migrating.
Confirmed Structure
The active 5M swing and its protected high or low show which confirmed short-term structure is currently intact.
The line changes with the market state.
The ETH Open AVWAP does more than display a volume-weighted average. Its colour reflects alignment between several internal context inputs.
The colour is context only. It is not an automatic LONG or SHORT instruction. The internal score and weighting remain hidden from the chart.
See what the active swing is protecting.
Alignment matters more than one level.
The indicator is designed to help several pieces of market context be read together.
Bullish Alignment
Price above CME Open, above a green ETH AVWAP, with confirmed bullish 5M structure and a protected low that remains intact.
Bearish Alignment
Price below CME Open, below a red ETH AVWAP, with confirmed bearish 5M structure and a protected high that remains intact.
Rotation / Conflict
When daily location, AVWAP and short-term structure disagree, the AVWAP can turn orange. Conflict is information too.
Know when something important changes.
Previous-day level alerts can be configured as Touch or Close Cross.
One Nasdaq futures context.
Research and context are developed around NQ. Traders executing through MNQ can use the same underlying market structure and reference levels while choosing their own contract size and risk.
The indicator does not execute trades automatically. Execution remains with the trader.